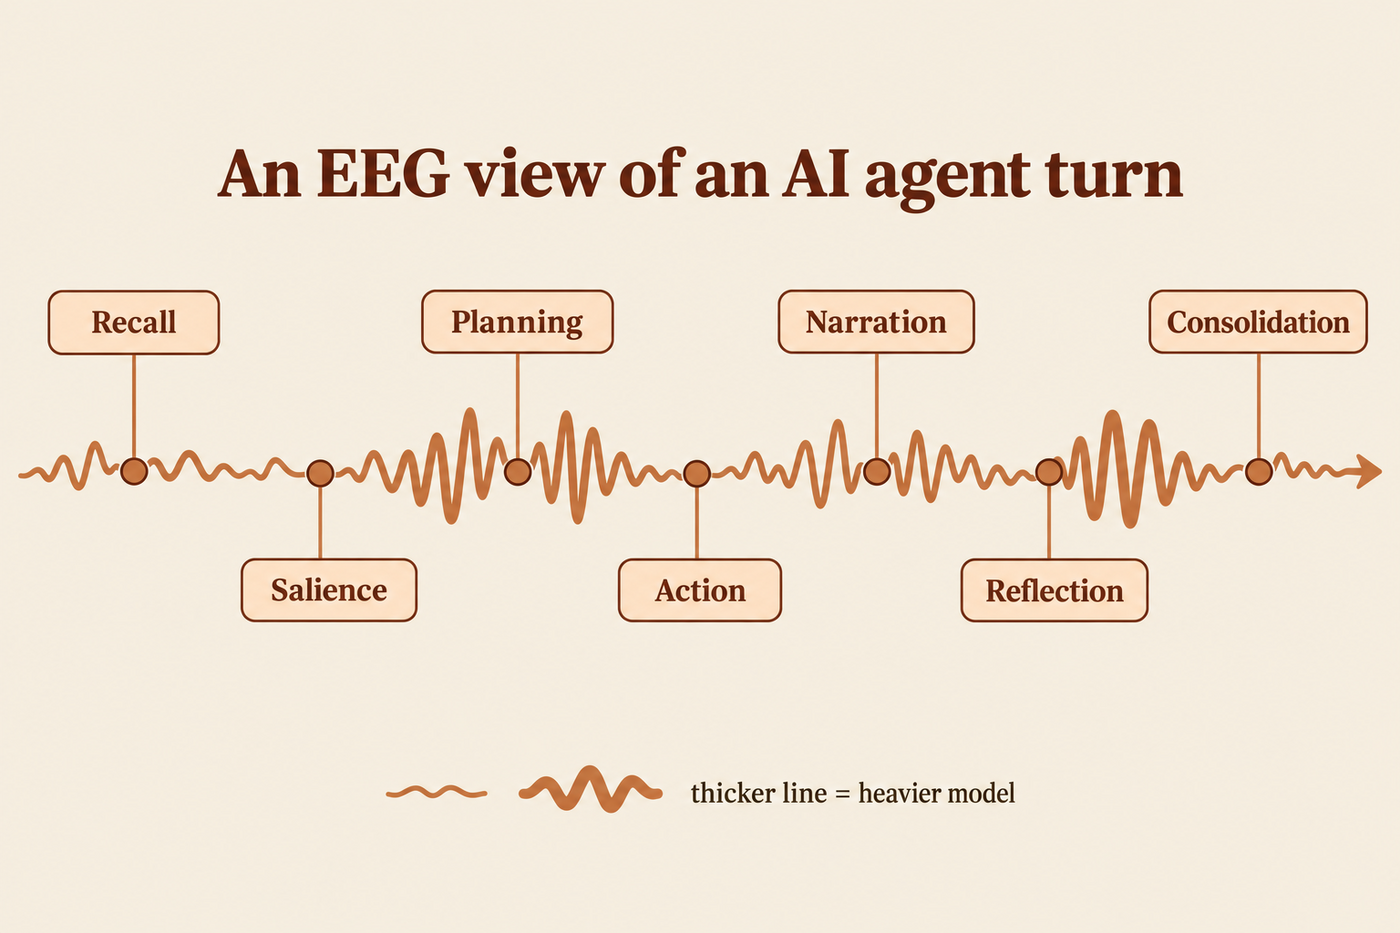
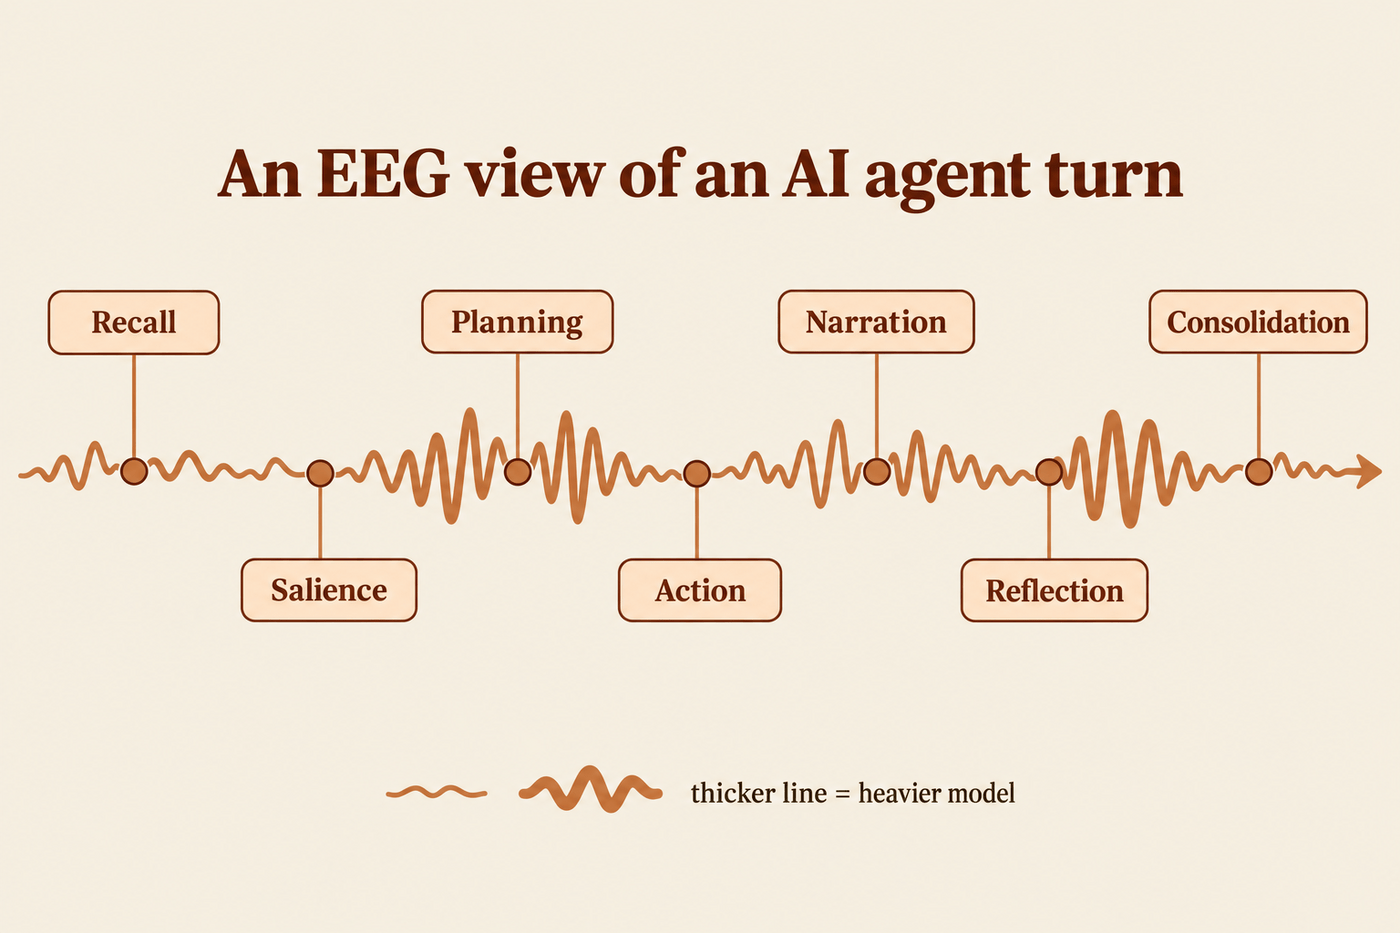
Most agents are black boxes. This one has an EEG. Every time my agent answers, it picks a model and decides how hard to think. The EEG view in TinkerClaw draws those choices as a live trace, together with what each one cost in euros. You can see where the effort went and where the money went, one prompt at a time. Part of the open Building Jarvis series.
What it shows
The EEG is a card in the Models panel of the Tinker UI, the web page I use to talk to my agent. It looks like a seismograph turned on its side. The paper runs vertically, the newest activity sits at the top, and older work scrolls down.
Each model call is a short vertical stroke, and three things about that stroke carry meaning.
- Where it sits, left to right, is the thinking effort. The columns are the effort levels: Auto, Minimal, Low, Medium, High, xHigh and Max. They line up exactly with the effort slider above them. The stroke sits at the level the model actually ran at, not the level someone asked for.
- Its colour is the provider. Orange for Anthropic, green for OpenAI, a rainbow for Google, pink for GitHub Copilot, and so on. The colour comes from the model that really answered, even when the agent chose it on its own.
- Its thickness is what that model costs me per use. This is my real cost per million output tokens. For subscriptions, the fee is spread over what I actually use. For pay-per-use providers, it is the published price. The thickness uses a logarithmic scale, so a model that costs a thousand times more does not draw a thousand times wider. The order is always right: a thicker line is always the more expensive model. To compare exact sizes, the model list in the same panel draws the costs on a straight scale.
A fourth thing is the length of each stroke, which is its cost in euros. The horizontal grid lines on the paper are labelled with real euro amounts for that tab, so a tall stroke means an expensive call. A thin but tall stroke is a cheap model that ran for a long time and still added up.
Prompts, helpers and tools
Each prompt I send draws a yellow line across the paper at the moment I send it. The trace breaks there and starts again, and smaller gaps separate the individual model calls inside one answer. Hover over a yellow line and the prompt text appears. Click it and the chat scrolls to that prompt and highlights it. That still works after a page reload.
When the agent hands part of a job to a helper agent (a subagent), the helper gets its own branch. It splits off the main trace when the helper starts and joins back when it finishes, like a branch in a version-control graph. Tool calls branch off the same way, coloured by the service they drive. An image generator that runs on Google shows up in Google’s rainbow, and a plain file search is a thin grey line.
Some jobs start many helpers at once. To keep the paper readable, the EEG draws at most 10 strands for each group of jobs that overlap in time, and it keeps the newest ones. A small counter in the margin, such as “×6” or “×9”, always shows the true number running in parallel.
One EEG per tab
Each chat tab has its own EEG. The paper shows the tab you are looking at, its own helpers and its own tool calls, and nothing else. The vertical axis means one thing only: how much this tab has spent so far.
The scale adapts to the tab. The EEG looks at the typical cost of one prompt in that tab and sets the spacing so an ordinary prompt draws a comfortable height. The grid then snaps to round amounts, like 1, 2 or 5 cents, or 1, 2 or 5 euros, whatever fits. A tab of cheap turns and a tab of expensive ones are both easy to read, each on its own scale. The trade-off is that you cannot compare heights between two different tabs. If you want a closer look, a right-button scroll over the paper zooms the vertical axis in or out.
The trace is kept for the whole session. It survives a page refresh, and since 5 October 2026, it also rebuilds a busy tab’s older history from the server, so earlier turns no longer go missing.
Why it exists
My agent chooses a model and an effort level for every task, on its own. A simple formatting job should go to a cheap model at low effort. A hard bug should get a strong model thinking at length. I wanted to see whether that routing really works, and the EEG is how I check.
An agent that says “done” tells you nothing about how it got there. With the EEG I can see whether it spent the most expensive model on a trivial job, how many helpers it started, and which prompt cost the most. Many small costs add up, and here I can watch them do it.
Where it fits
The EEG makes no decisions itself and only shows what happened. The choices come from other parts of TinkerClaw. The effort allocator from the Prefrontal and Salience designs picks the model and the effort. The Thalamus card, higher up in the same Models panel, shows who ran this turn, at what effort and why. You can also override the choice by hand with the effort × model slider. The EEG then draws the result and its cost.
What it does not do yet
The euro figures count output tokens only. Nothing records the input tokens yet, so every amount on the grid is an underestimate. Adding them means deciding how to price cached input, and I have not decided that yet. The costs for most providers outside Anthropic are also estimates for now.
There is one more known limit. Helper runs do not yet record which tab started them, so if another tab starts a batch of helpers while this tab is active, they can show up here too.
An earlier version of this page described the EEG as seven thinking stages and mentioned a Session/All switch that showed every session at once. Both were wrong for today’s EEG. The columns have always been effort levels, since I built the panel on 13 June 2026, and I removed the switch on 1 October 2026 when each tab got its own EEG.
TinkerClaw is open source. The whole architecture, including the brain-region anatomy, the recipes, the effort allocator and the EEG, lives at github.com/globalcaos/tinkerclaw. This post is part of the open Building Jarvis series at The Tinker Zone.
Everything on the site, by topic or date: Browse the Tinker Zone