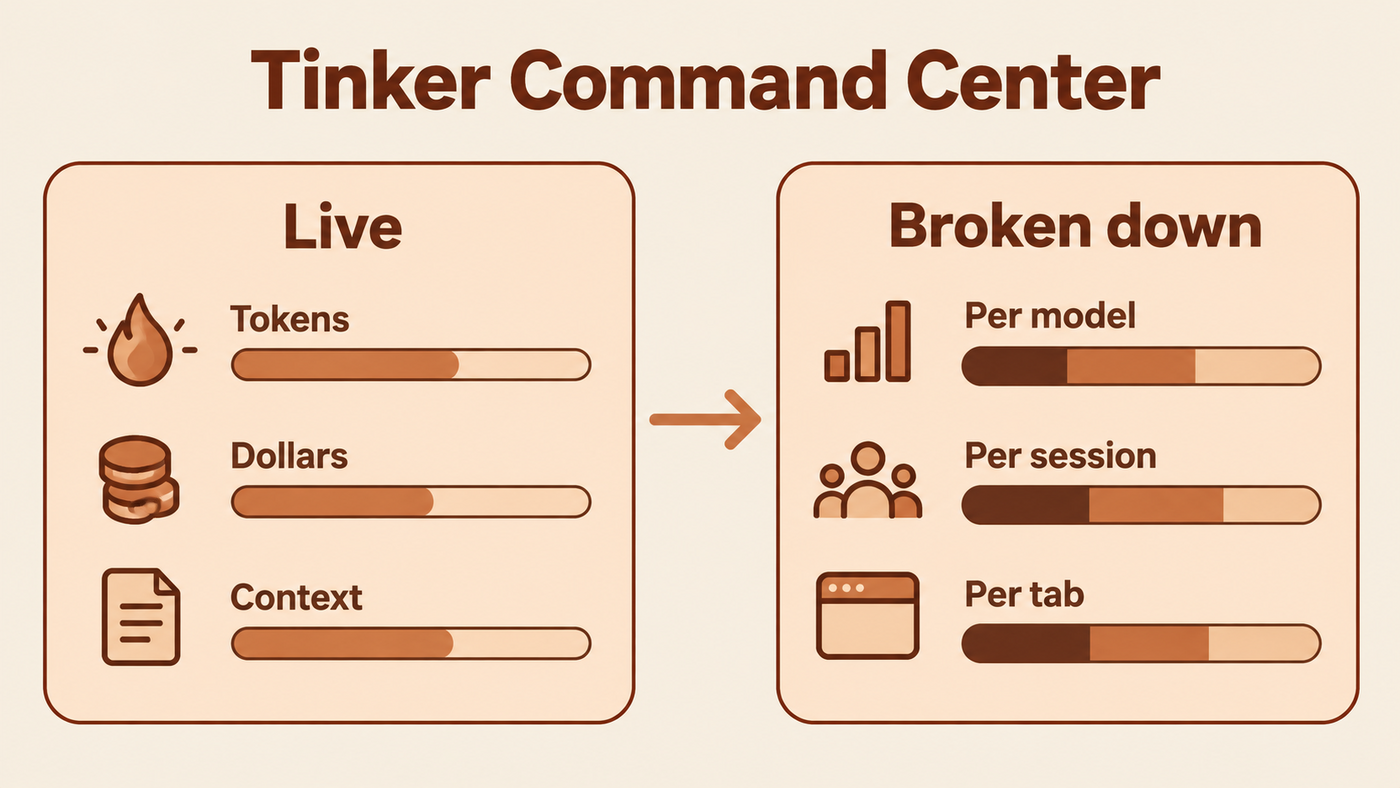
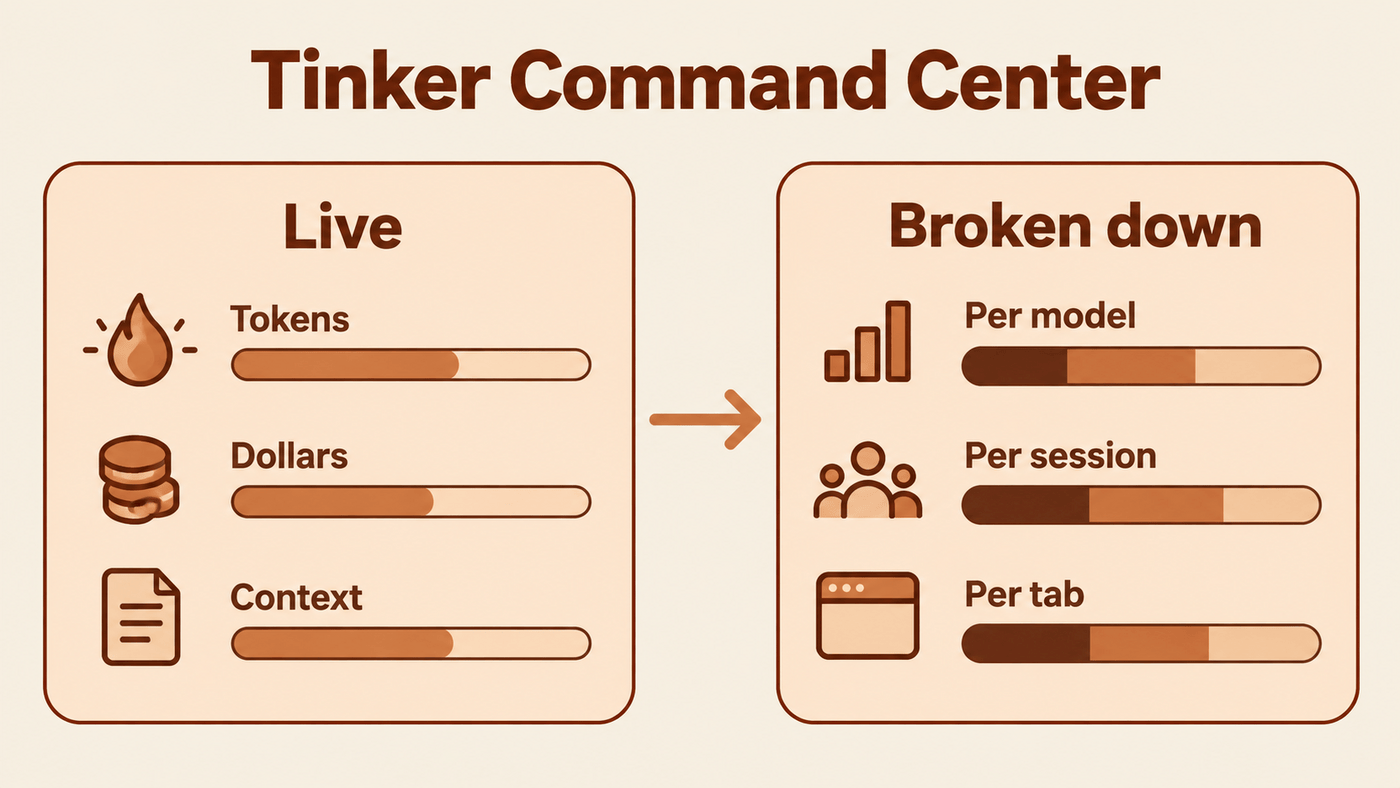
Stop guessing what your AI costs. The Tinker Command Center is the part of the TinkerClaw UI that shows every token, every euro and every byte of context while you work, per model and per tab. Part of the open Building Jarvis series.
Where it lives

It is not a separate page. It is the Models panel on the right of the chat, plus two groups folded into it: the Context Window and the EEG. They always describe the tab you are looking at. A Session / All switch at the top of the panel widens the model list to every tab at once.
What is in the window

The coloured bar is what the model reads on each call, split by kind: system prompt, files, skills, tools, conversation, your own words. It is drawn against the size of the model’s window, so you see at a glance how close a tab is to full.
Under it, counters for this call and this session: turns, compactions, evictions, tokens dropped. The Evict and Compact buttons let you shrink the window by hand, and the call timeline draws each model call of the current prompt live.
What each call cost

The EEG turns spend into a trace. Each model call is a stroke. Its column is the effort it ran at, its colour is the provider, and its height is what it cost on euro gridlines scaled to the tab. Yellow lines mark your prompts, so you can see which question was the expensive one.
The full guide to reading it is Watching an Agent Think.
Which model is worth it
The AI Analysis button at the top of the Models panel opens the Smartness × Cost map: every model plotted by how smart it is against what it costs. It answers the question the bill raises next, whether a cheaper model would have done the same job. The map is public as the AI Analysis page.
Why it matters
Agent cost is invisible by default, and invisible cost is the kind that surprises you at the end of the month. Here spend is a number you watch while you work. “The agent did a lot” becomes “the agent did a lot, here, for this many euros”, and that is the difference between a tool you trust and one you are nervous about.
Seeing the cost is half the loop. The effort × model slider is the other half: it lets you decide what to spend next.
What it does not do yet
- Costs count output tokens only, so every euro figure is an underestimate.
- Prices for most providers outside Anthropic are estimates.
- The skill version on ClawHub, tinker-command-center, packages the same UI as a skill.
TinkerClaw is open source. The whole system, from the brain-region modules to the recipes, the router and the EEG, lives at github.com/globalcaos/tinkerclaw. This post is part of the open Building Jarvis series at The Tinker Zone.
Everything on the site, by topic or date: Browse the Tinker Zone