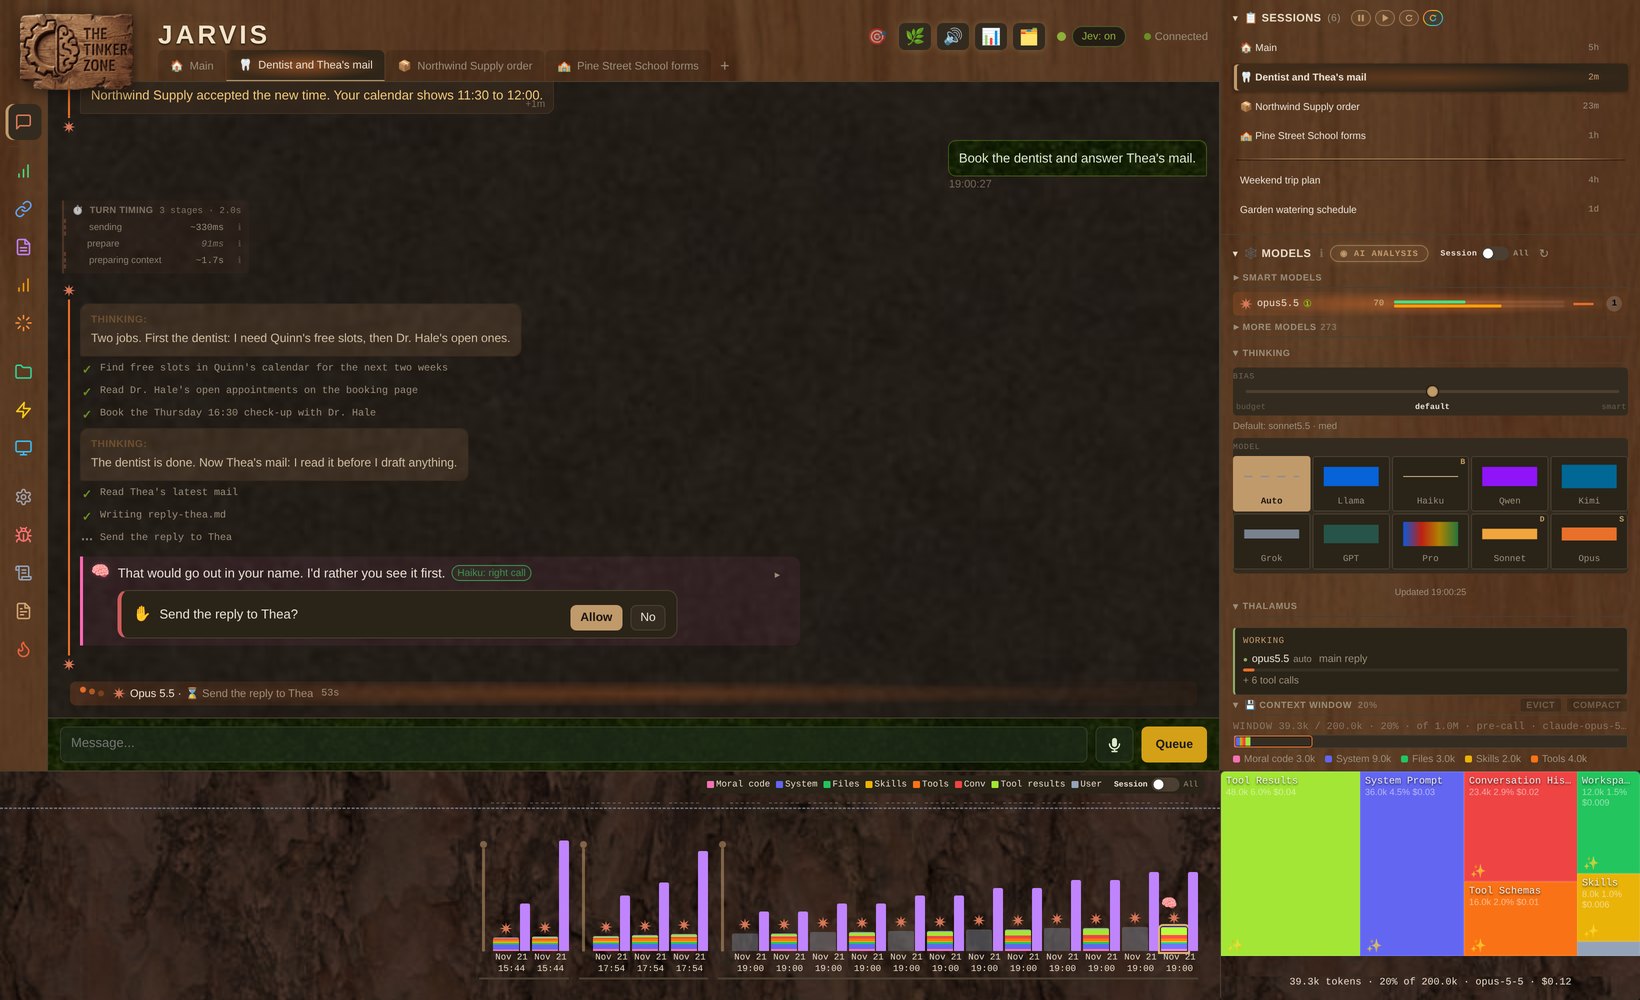

Your agent says “Done.” Which invoices did it open, and why is there a delete in there? Quinn had asked Jarvis to file the Northwind Supply invoices into the expenses sheet and gone to make coffee. Twenty minutes later, scrolling up gives either nothing or three screens of raw command output. And on Friday the week’s quota is gone, with no clue which chat ate it.
You can’t judge work you can’t see, so you review none of it, or all of it. Reviewing none is how a wrong row ends up in the books. Reviewing all of it means doing the job twice, and then the agent saves you nothing. Money goes the same way: you can’t trim a cost you can’t point at.
An agent becomes something you can trust and afford when it shows four things while it works: what each step was for, what the model actually read, what each call cost, and what the plan is. TinkerClaw puts each of those on screen.
Every step reads as a sentence

A good lab notebook says why before it says how: “weighing the sample to confirm the dilution”, then the numbers. TinkerClaw asks the agent to work the same way. Before each tool call it writes one sentence naming the file or the search and the question the call answers, and the closed row in the chat shows exactly that sentence.
So the invoice job reads top to bottom like a short story. “Opening the March folder to find the Northwind PDFs.” “Reading invoice 0412 to get the total and the due date.” “Adding the 0412 row to the expenses sheet.” Click a row and it opens to the exact command and what came back. If the agent skips its sentence, the row falls back to a plain summary of the command, so nothing goes missing.
Most agent screens give you a choice of none of this or all of it at once. Here the story stays short, and the proof is one click away on every line.
See what the model actually read

A total on a receipt tells you nothing; the lines tell you where the money went. The same holds for a prompt. The context map splits the last call’s prompt into blocks by kind: the moral code, the system prompt, the files loaded into it, the skills, the tool definitions, the conversation, the tools’ output and your own message. Each block’s size is its share of the tokens. Click one to see what is inside it, and click again to read the text itself.
Next to it, the context window bar shows how full the window is and how much of the prompt the provider served from its prompt cache at a lower rate, against what it billed as fresh input. Below it, the call timeline draws one column per model call in your latest request: above the line what each call sent, below it what came back.
This matters because a long chat is mostly re-reading. In one long chat we measured, the agent re-read about six hundred tokens for every token it wrote. Once you can see that, you can act on it: drop a file nobody needs, cut a tool’s output short, start a fresh chat for a new job.
Watch the spend as it happens

A taxi meter is annoying, and you still trust a taxi with a meter more than one without. The Models panel has one, the EEG: a trace that grows a segment for every model call as it happens, coloured by provider, sitting at the effort level the call ran at, and thicker the more the call cost. A helper agent branches off the main line, so you see a request fan out into several models and which branch is the expensive one. Hover a segment for its tokens: written, read fresh, and read from the cache.
The trace’s cost is an estimate from a price table. For the real figure, the budget panel asks the providers that report it for their own usage or remaining quota, and refreshes every ten minutes. The estimate tells you which call was expensive, and the provider’s figure tells you where you stand.
See the plan and the helpers

The last question is “what is it doing now, and what is left?”. The plan board shows the agent’s plan as a checklist with the live step marked. With no formal plan it still says what is going on: thinking, the tool it is running, writing the reply, or idle and waiting for your next message. It never sits blank. Each helper agent gets its own row with its task in plain words, the tool it is running, how many tools it has called and how many tokens it has used.
Work that runs while you are away has a board too. The cron board lists the scheduled jobs with how each last run ended (fine, failed, or silent) and the one-line headline it reported.
All of this is baked into TinkerClaw
These panels are part of the Tinker UI in TinkerClaw, which grew out of OpenClaw.
I tinker with ideas like these all the time, and the moment I get wind of a better trick, or need something extra in my day to day, I bake it into the code. If you want to see where that habit leads, I wrote about it in from block to blob.
For builders
- Executive Function (PDF): the PREFRONTAL layer that gives the agent a plan it follows and reports on; it is the paper behind See the plan and the helpers.
- Budget Prompting (PDF): why every turn re-bills the whole context and the techniques that cut it; it is the paper behind See what the model actually read and Watch the spend as it happens.
- Total Recall (PDF): what stays in the context and what gets folded away without losing it; it decides much of what the context map shows in See what the model actually read.
There are more papers behind TinkerClaw, on memory, guards and how the agent picks a model. You can find them by topic on the brain map and the site map.
Leave a Reply